
In line with the initial How to Build a Trading Strategy article we will call the new trading strategy "My Second Strategy". We will keep the standard 'Strategy Setup' with the exception of the 'Trail Stop Percentage' which we will set at "10%" instead of "5%". It will be a long only strategy.

The Active Trader stock list will be the test-bed: Apple (AAPL), Boeing (BA), Citigroup (C), Caterpillar (CAT), Cisco (CSCO), Disney (DIS), Ford Motor Company (F), Hewlett Packard (HPQ), International Business Machine (IBM), Intel (INTC), International Paper (IP), J.P. Morgan (JPM), Coca Cola (KO), Microsoft (MSFT), Starbucks (SBUX), AT&T (T), and Wal-mart (WMT).
Before I jump to the editable rules I will configure the backtest period from the start of 2000 to the end of 2007; effectively covering the last major cyclical bear and bull market. Later I will run an out-of-range test from the start of 2008 to the current day.
The key element I will be looking at will be modifying the technical rules. There are two ways of creating your own rules; the first involves modifying an existing rule - if you are doing this you need to do a 'Save As' and give your rule a new name - otherwise your changes won't be saved.
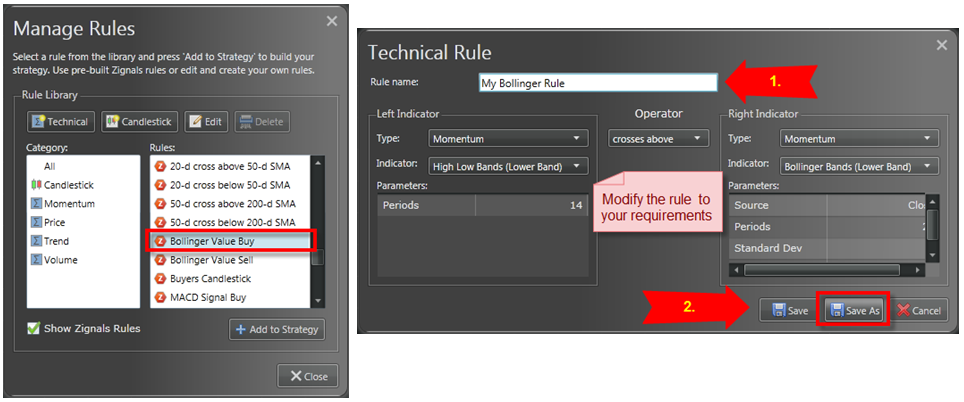
The second way is to create a new rule by choosing either [Technical] or [Candlestick]

For modifying rules I selected for indicators which use a single input parameter/period as testing relative performance is easier. But I did adopt assumptions for a positive trigger. The following technical indicators and their assumptions are given below.
[Momentum] RSI crosses above 30
[Trend] Linear Regression slope crosses above 0
[Volume] Money Flow Index crosses above 20
When reporting the initial set of results I only used the outputs given in the Trading System Results - I didn't look to the more detailed outputs offered by the Portfolio Manager.

How did each indicator perform independently?
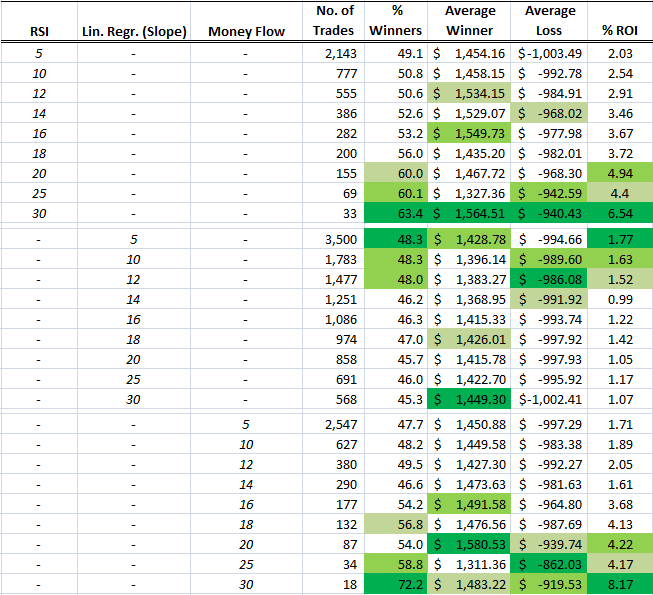
There were two strong performing indicators: RSI and Money Flow. In the case of RSI the best returns came from using non-traditional period settings, although the total number of trades generated was low (which can skew the results). Similarly, Money Flow also posted good returns using higher period settings. For both RSI and Money Flow, period values of 20 days or more generated an average ROI of over 4% per trade. The caveat is the use of trailing stops and defined targets - not the traditional inverse 'sell' trigger for an exit - so this may in part explain the stronger performance from the longer period range. When you consider the (non) performance of the S&P over the test period this is quite incredible.
Second Step
We could probably stop here and just use either a long period RSI or Money Flow indicator as our entry trigger. But is there a way to improve this return? Will a mix-and-match offer a better return?
The first match was to use RSI [5] with Linear Regression Slope [5] and Money Flow Index [5]. For each combination type there was a large number of signals, increasing the probability for a good subset of results. For a trigger to be true, all signals must occur on the close of business on the same day.

Pairing of the aformentioned indicators brought improved performance over individual indicators. Better still, using all three in tandem brought the strongest performance with a healthy 156 trades (approximately 22 a year) with an average return of 5% per trade and nearly 60% winning trades. Of the paired indicators, a combination of momentum (RSI) and trend (Linear Regression Slope) brought the best returns at an ROI of just over 4% per trade with 56% winners.
A unique feature of the Zignals Trading System Builder is the ability to create multiple trigger paths for a trade. So while the aforementioned examples were created with simple linear paths we can modify them to allow for OR scenarios.

Third Step
How did paired matches perform using different period settings? Can performance be improved over the individual indicator?
The first matched RSI and Linear Regression (Slope).

This combination generated few trades outside of RSI [5] and Linear Regression (Slope) [5] and RSI [10] and Linear Regression (Slope) [5]. The [5] / [5] setting was the best performer with an ROI of 4.15% over the 3.24% ROI of [5] / [10]. Beyond these two the number of triggered trades was too low to generate consistent results; neither combination beat RSI [20] with its 155 trades and ROI of 4.94%.
The second match of RSI and Money Flow produced a more diverse range of signals, but there was no significant improvement in ROI; best of the pairings was RSI [10] and Money Flow [10] for a 3.83% ROI, but below the aforementioned 4.94% of RSI [20].

The last comparison paired Linear Regression (Slope) with Money Flow. As with the earlier pairing of Linear Regression (Slope) with RSI, the number of generated trades was low. Linear Regression (Slope) [5] matched with Money Flow [5] or [10] had the most trades with a 3.40% and 2.42% ROI respectively - the worst return for any of the pairings.
Fourth Step
The final step extends the second step by looking at alternative period settings for the three indicators together. But outside the initial set of RSI [5], Linear Regression Slope [5] and Money Flow [5] there were very few trades.

Out-of-test
The final phase ran the two best set-ups from the start of 2008 to the current day.
The three-indicator set up -RSI [5], Linear Regression (Slope) [5], Money Flow [5] -generated 37 trades with 65% winners and an ROI of 6.92%. RSI [20] didn't perform as strongly with 58 trades on 52% winners and 2.26% ROI.
Global Trading Strategies
Based on the aforementioned results I have published the following strategies available in Trading Strategy MarketPlace:
Tri-Indicator US, Tri-Indicator UK, Tri-Indicator India, Tri-Indicator Aussie, Tri-Indicator Frankfurt, Tri-Indicator Forex, Tri-Indicator ETF, Tri-Indicator Irish, Tri-Indicator Canada, and Tri-Indicator US Dividends.
Relative US, Relative UK, Relative India, Relative Aussie, Relative Frankfurt, Relative Forex, Relative ETF, Relative Irish, Relative Canada, and Relative US Dividends
How did the strategy perform across market types? This time there was a clear winner:

RSI [20] had an average ROI range of -2.86% to 4.04% with a Standard Deviation of 2.66%.
RSI [5] + Money Flow [5] + Linear Regression (Slop) [5] had an average ROI of 4.03% with a range of 0.68% to 7.60% on a Standard Deviation of 2.45%
Summary
Single event triggers can offer strong returns but sacrifice consistency. Multiple trigger events per trade can improve performance stability across market conditions and market types, even if net return per trade can sometimes be lower.
Follow us on twitter here
How to Get Started with Zignals
Build a trading strategy in Zignals and potentially earn money too; download our Build a Trading Strategy PDF and get selling (and trading) today!
Dr. Declan Fallon, Senior Market Technician for Zignals.com, offers a range of stock trading strategies for global markets under the user id: ‘Fallond’, ‘ETFTrader’ and ‘Z_Strategy’ available through the latest rich internet application for finance, the Zignals MarketPortal or the Zignals Trading Strategy MarketPlace.
Zignals offers a full suite of financial services including price and fundamental stock alerts, stock charts for Indian, Australian, Frankfurt, Euronext, UK, Ireland and Canadian stocks, tabbed stock list watchlists, multi-currency portfolio manager, active stock screener with fundamental trading strategy support and trading system builder. Forex, precious metal and energy commodities too. Build your own trading system and sell your trading strategy in our MarketPlace to earn real cash. Read what others are saying about Zignals on Investimonials.com.
JOIN US TODAY - IT'S FREE!


