It looks as though there continue to be a large number of signs that we are in a topping area. Volume, AI, trading ranges, MACD, RSI, ignoring of news, complacency, persistent but small advances day after day all are warning us that it is a one-sidedmarket. In the past, as we have noted above, such action has been a precursor to a decline, but not necessarily a panic or crash. So I do not want to come across as an alarmist. But I am concerned that we seem to have an underlying potential for another traumatic break that is neither understood nor preventable.
On the other hand, there is not yet any evidence of a turn. To become concerned we would need to see a number of days in which the market moved lower, volume became heavier and trading range became larger. We would also see a crossover in the MAACD and the breaking of some likely support levels. It seems as though the first part of a scenario has occurred or is occurring, but there is no evidence yet of a shift to the nextstage.
So not a glowing projection to the road ahead. Richard's watch-levels were 1,313 for the S&P and 12,075 for the Dow. Both of these price levels were sliced the past few days, and both defended, so far, this Friday.
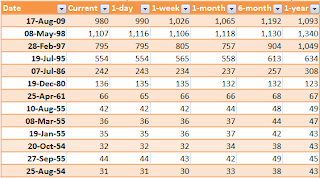
At the end of January I concluded (for the S&P):
Compared to last month's bear-derived projections this is still a substantial improvement on the 1-year outlook. It doesn't eliminate a likely 10%+ haircut in the first half of 2011, but it does suggest things will be more positive by year end. Such behaviour - if it comes to fruition - would fit with a cyclical bull market.
Going forward, we have new support for the rally at 1,260 with a cross of the 20-day MA a suitable alternative. As for upside, keep the measured move target of 1,392 on the radar.
At the time of my last post the S&P closed at 1,299, yesterday it finished at 1,306, a 0.5% return. This was below the mean expected return of 1.3% (which suggests projections are on the optimistic side, but in the right direction).
As of Thursday's close the S&P was 11.8% above its 200-day MA, 1.4% above its 50-day MA and -0.7% below its 20-day MA. This scenario had matched against 13 historic periods. Although 6 of the 13 covered the years 1954 and 1955.
If we focus on the 1954-1955 period it is clear this rally could roll on for another 12 months; it wasn't until 1956 that the 1953-started-rally entered a consolidation phase.
If we look at the current projections in relative terms there is a marked rise in expectations. The low-ball 95% confidence interval estimate 1 year later is for a gain of 10.9%, while the mean projection for the same period is for an 18.7% gain. This is well above the projections given in January. Downside protection can be 'bought' below -1.1%; this was the lowest 95% confidence value across all time frames and covered the period of next week - although it does not cover volatility between the periods (i.e. the market could shed more as long as it's only down -1.1% come next Thursday). If the S&P was to lose more than 1.1% from yesterday to next Thrusday's close it would effectively throw-out the projection estimates.
Taking worst-case scenario projections and applying them to the S&P can identify support areas. Applying a 1.1% decline to yesterday's close of 1,306 sets a watch level of 1,291. Because 1,291 has no natural support the closest approximate is a prior consolidation zone between 1,275 and 1,295. Thursday's close did offer a convergence of rising trendline support and horizontal support at 1,295 - an area bulls defended in early Friday trading.

As for the outlook going forward. Using a Zignals Alert for a break of 1,275 will offer warning the aforementioned projections are pie in the sky and a more conservative approach should be adopted. This is a step up from the previous Alert threshold of 1,260 from January. Ride the trend until the next support level comes clear. The 1,392 remains the measured move target.
-----
Why not start your Zignals Trading Strategy Business with us today? Learn How to promote your Zignals Trading Business with Twitter.
Follow us on twitter here
Build a trading strategy in Zignals and potentially earn money too; download our Build a Trading Strategy PDF and get selling (and trading) today!
Dr. Declan Fallon, Senior Market Technician for Zignals.com, offers a range of stock trading strategies via his Zignals home page. Each Zignals member has an unique home page which they can share with friends and clients to sell their strategies.
Zignals offers a full suite of financial services including price and fundamental stock alerts, stock charts for Indian, Australian, Frankfurt, Euronext, UK, Ireland and Canadian stocks, tabbed stock quote watchlists, multi-currency portfolio manager, active stock screener with fundamental trading strategy support and trading system builder. Forex, precious metal and energy commodities too. Build your own trading system and sell your trading strategy in our MarketPlace to earn real cash. Read what others are saying about Zignals on Investimonials.com.


