In my last post on the S&P in November I finished:
So, while it's easy to diss the advance there is little evidence to suggest it will all come tumbling down like a house of cards.Since last month the S&P has advanced by nearly 2% and doesn't look like it's going to stop anytime soon. The November outlook was bullish across all time frames for the coming 12 months, but has anything changed to suggest otherwise?
Prudent profit taking while maintaining a positive outlook is the way to be until the market decides otherwise. It will take a hard break of 1,000 for the S&P to offer up a bearish tone, and even then the risk of a bear trap will be great given the market will have to drop 18% to get there (based on Friday's close).
As of Monday's December 13th close the S&P was at 1,240 and was trading 2.8% above it 20-day MA, 3.9% above its 50-day MA and 8.9% above its 200-day MA.
In terms of extreme days, the S&P is more bullish than 79% of historic trading days going back to 1950.
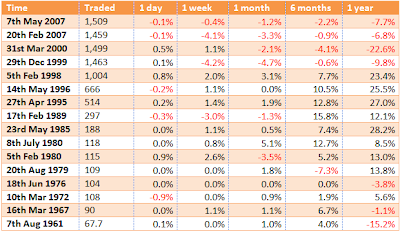
Comparing the projection from November to December there is a slight bullish shift, particularly for the next 6 months. The mean return after 6 months was +4.3% with a 95% confidence interval range of +1.1% to +7.6%.
However, there is a caveat. The bulk of the strong returns were posted in the last secular bull market from 1980-2000. If we consider only the matches for the current secular bear market, namely 2000 and 2007, then the outlook is negative with the bulk of losses in the 6-12 month window. The immediate 6-month outlook, based on secular bear market data, is a mean loss of -2.4% with a 95% confidence range of -0.6% to -4.3%. But over the next 6-month period the market lost on average -12.4% with a confidence range of -2.3% and -22.4%.
Whether you consider the entire data set of matches back to 1950, or just look at the current secular bear market matches, the outlook for the coming 6 months is at worst mildly bearish. The latter part of 2011 might be the time to adopt a more cautious approach, particularly in the seasonal weak period of September-October.
As for the current rally, while it may only have a couple more percentage points in the tank it may not collapse like a house of cards. Working in the bulls favour is a sizable cup-and-handle pattern with a projected upside target of around 1,392; a loss of 1,220 will kill the cup-and-handle.
----
Why not start your Zignals Trading Strategy Business with us today? Learn How to promote your Zignals Trading Business with Twitter.
Follow us on twitter here
How to Get Started with Zignals Build a trading strategy in Zignals and potentially earn money too; download our Build a Trading Strategy PDF and get selling (and trading) today!
Dr. Declan Fallon, Senior Market Technician for Zignals.com, offers a range of stock trading strategies via his Zignals home page. Each Zignals member has an unique home page which they can share with friends and clients to sell their strategies.
Zignals offers a full suite of financial services including price and fundamental stock alerts, stock charts for Indian, Australian, Frankfurt, Euronext, UK, Ireland and Canadian stocks, tabbed stock quote watchlists, multi-currency portfolio manager, active stock screener with fundamental trading strategy support and trading system builder. Forex, precious metal and energy commodities too. Build your own trading system and sell your trading strategy in our MarketPlace to earn real cash. Read what others are saying about Zignals on Investimonials.com. JOIN US TODAY - IT'S FREE!


