
[1] Select a stock on a two year chart with the indicators of choice. In this example we will use three moving averages (10-day EMA, 20-day EMA and 50-day EMA) with the Money Flow Index. The stock you choose should be representative of the stock(s) you wish to trade with respect to Beta.
[2] Highlight the ideal buypoints. This is to focus the eye on the conditions of the technicals at this time (also price relative to the moving averages).

[3] Summarise the conditions of the indicators at the point of the ideal 'Buy' signals.

[4] Run a preliminary backtest to view strategy performance. The above conditions are still quite general, so signals are unlikely to match, but it will give an indication as to what can be expected.
Use default risk management and stock list (18 U.S. stocks) on 2 years of data (matching the chart timeframe). Starting Capital is $100,000 with a maximum 10% of capital assigned to any one position.

[5] For the record, the S&P gained 10.1% over this period; so anything above this is beating the market, anything below is underperforming.
This strategy generated the following statistics

And the following signals in MSFT

The initial prognosis was good; one of our three ideal entry points were hit and remaining signals were close to swing lows. Note: This step is not about profitable trades, it's about timing for good entry signals. For example, the Feb 2010 signal caught the swing low, but under the default exit conditions it closed for a loss. Use the Strategy Statistics and Performance as a guide.
[6] Next it's time to optimise the entry signals. We could do this by adding another technical indicator. This time we add Relative Strengh Index (RSI) at a setting of 5-bar periods (over the default 14 period) and again record the values of this indicator at our optimum signals:

Our updated values for our strategy are now:

An improvement over the earlier ruleset. The MSFT triggers are now:

The strategy keeps the good February 2010 signal. The June 2010 signal is close enough to considered true, and while the February 2011 signal is well off the desired June 2011 signal, the strategy did catch the later August 2011 reaction low.
At this point we won't tinker too again with the signals - next we will look to adjust the exit
[7] The signal exit is governed by the risk management settings in the Setup menu.

Step 1: How far can the initial stop be tightened in order to maximise the good (swing low) signals? The idea is to minimise damage caused by poor signals like the one in February 2011 for MSFT, while preventing early stop exits in strong signals.
Tests of different Stop Percentage suggested an optimum value of 9%.
Step 2: How soon should the Trail Targets & Stops be used? The use of Trails is governed by the Target Percentage. When the Target Percentage price is hit the Trail Targets&Stops are activated. Tests of different Target Percentages between 5% and 15% generated little change in Strategy Net Profit, but there was a sharp drop when the Target Percentage was 4% or below.
Although the best profits were returned when the Target Percentage was 5%, it was too close to the drop zone to recommend its use, so the next best was 9%.

Step 3: With the Trail Targets & Stops kicking in after a 9% gain, next is configuring where to place the Trail Stop and how often the Trail Stop should be adjusted by use of the Trail Target.
Because most trades will exit at the Trail Stop it's important to give positions a chance to ride the recovery trend. The Profit Target governs the top side exit, but it can be raised so it's not a factor in the final signal exit (e.g. set at 999%). However, this is not the next step.
The interdependant relationship between Trail Stop and Trail Stop means pairing each combination is necessary to maximise Strategy Net Profit. This offered the following table for Net Profit
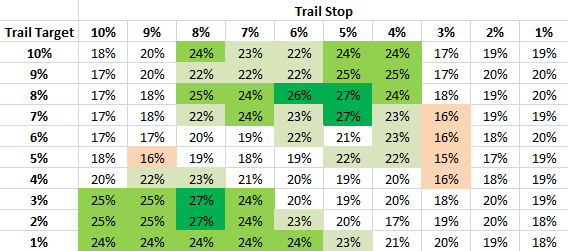
As a mountain chart, Net Profit looked like this

Step 4: The final step is comparing the strongest combinations of Trail Target and Trail Stop to differing Profit Targets (Note: Net profit is slightly different to previous values due to differing backtest dates)
The optimum combination of the Trail Target, Trail Stop and Profit Target is 7%, 5% and 25% (Note: testing 24% and 26% as a Profit Target didn't improve returns).

[8] As part of the strategy a quick test can be done to compare performance during a bear market - in this case, from October 1st 2007 to March 31st 2009. During this time the S&P lost 48%, while the aforementioned strategy lost a more palatable, although not ideal, 33%.
[9] Publish your strategy. This will list the strategy on your home page and can be promoted on Facebook or Twitter. Trading signals will also be delivered for free in real-time to your email address.
If you are interested in getting the signals for this strategy you can subscribe to it here.

--------
Follow us on twitter here
Dr. Declan Fallon, Senior Market Technician for Zignals.com, offers a range of stock trading strategies via his Zignals home page. Each Zignals member has an unique home page which they can share with friends and clients to sell their strategies.
Zignals offers a full suite of financial services including price and fundamental stock alerts, stock charts for Indian, Australian, Frankfurt, Euronext, UK, Ireland and Canadian stocks, tabbed stock quote watchlists, multi-currency portfolio manager, active stock screener with fundamental trading strategy support and trading system builder. Forex, precious metal and energy commodities too. Build your own trading system and sell it in our MarketPlace to earn real cash. Read what others are saying about Zignals on Investimonials.com.
JOIN US TODAY - IT'S FREE!


