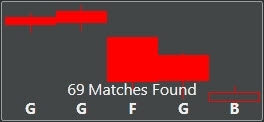
What was unusual about this pattern was the poor short term performance, offset by a stronger long term performance.
| Match | No. of Patterns |
1-day % Win |
2-day % Win |
5-day % Win |
Average Return Per Trade (> 5 day) |
| Weakest | 183 | 50 | 54 | 56 | 5.1 |
| Weak | 137 | 52 | 52 | 58 | 6.1 |
| Neutral | 69 | 46 | 43 | 49 | 6.6 |
| Strong | 24 | 51 | 42 | 33 | 5.5 |
| Strongest | 0 | n/a | n/a | n/a | n/a |
Given the coin-toss probabilities over the 5-day outlook, bar the 67% probability for a lower close on the fifth day on the Strong Match, it's not a pattern to generate short term interest.
However, when the Average Return Per Trade was considered (Average Return Per Trade assumes an initial stop of 10%, raised to 5% off the price reached on a 15% gain. Ultimate Profit Target of 25%) the performance of the pattern improved. The win percentage of the pattern when applied with the aforementioned risk strategy, ranged from 58% at the Strongest match to 65% at the Neutral match. The latter match also having the Average Return Per Trade.
Using the Neutral match and running a market scan returned 61 matches. One such match was for Marshall and Ilsley (MI).

With the stock trading above its 50-day MA and 200-day MA (and the 50-day MA riding above its 200-day MA) there is good reason for Marshall and Ilsley to be one of the 65% to close in profit (and if it is, the average return from winning trades is 13.4%).
Learn more about PatternDNA
Zignals PatternDNA from Declan Fallon on Vimeo.


