
[1] Go to Tools-Charting.
[2]You can then select Markets and Countries you want to include in your search, from the filter list.

[3] Type in your stock name or Ticker code in the input box. I picked a SLV A Silver ETF
[4] Click on the draw button to access the drawing toolbar.
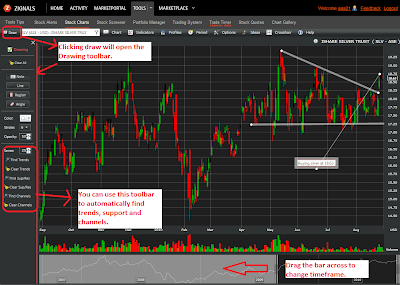
[5] You can then decide what indicators you would like to overlay on the chart. You can also apply indicators on indicators ,eg moving averages on Volume, etc.
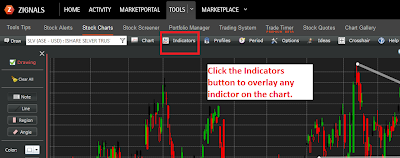
[6] You can then compare you chart to others by clicking on Chart->Compare.
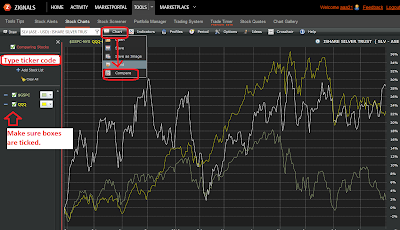
[7] You can then save your chart for easy access later on. Or 'save as image' to post to your blog or trading diary.
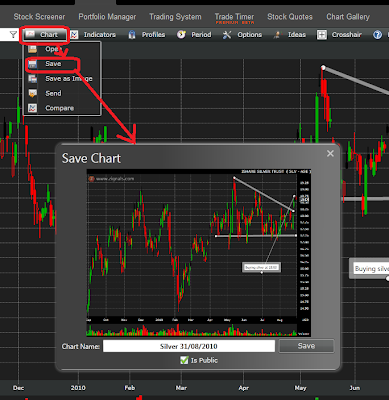
[8] When your done you can submit a new trading idea based on the chart. Your ideas will be then saved and will appear on the chart.
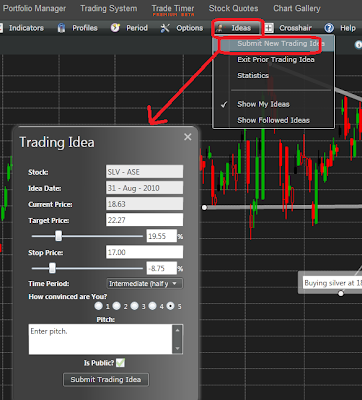
These are just a few of the things you can do on the stock charting software at Zignals.com . If you have any particular functions you like or would like to see, you can post them in the comments section.
Thanks,
-Chris


